Long gone are the days of bike computers showing you just a single elevation profile for your entire route, or even just the near-term elevation profile. These days, the bike computers will automatically break down and even categorize the climbs on your planned route, along with rea-time status, until the suffering is complete. And in this case, I’ve done a lot of suffering for this one.
This is a post and video I’ve been working on since last summer, and each time I went out to shoot this video, a certain company (cough…Hammerhead) would literally release a substantial update to their climbing app feature the following day or week. Without fail, every…single…time. Be it last August or last December, it kept happening.
So obviously, the only solution to that was to re-test and re-shoot it again with the new features, which of course require going out and riding another epic climb. Thus, the video above. Covering five epic climbs from the Dolomites to Switzerland, and both off-road and on-road climbs in Tenerife and the Canary Islands. Plus numerous other climbs along the way. In some cases, these were gigantic single climbs up a volcano, and in others it was a series of climbs, both of which test the features in different ways.
You’ll notice I didn’t list a specific version/model for the three main companies. That’s because from a technical standpoint, the features are equal among their latest units for climbing purposes. Thus, specifically, these units:
Garmin: Edge 530, Edge 830, Edge 1030, Edge 1030 Plus
Hammerhead: Karoo 1, Karoo 2
Wahoo: ELEMNT, ELEMNT BOLT V1/V2, ELEMNT ROAM
For example, there’s no differences between an Edge 530 and Edge 1030 Plus when it comes to climbing features (aside from just screen size). Same goes for Wahoo ELEMNT ROAM vs BOLT. Note that the Edge 130 Plus does have ClimbPro, but just not the coloring since it’s a black and white screen.
Pre-Ride:
The first component to understand is that all of these require some amount of pre-ride planning to enable. Meaning, that they all require you have a course loaded in order to function. Unlike something like Strava Live Segments, which largely automatically trigger, the climb functions on Garmin & Hammerhead need a route loaded. As for Wahoo? Well, there’s actually almost no climb functions there, but instead, you can use Strava Live Segments in a pinch, but you’ll want to do some planning there to ensure those specific segments match your climbs.
So, let’s start with a route I’ve created with Strava, and then synced to the devices. At this point, there’s no differences in terms of the source (e.g. Strava vs Komoot vs others, and in fact, I use routes from different platforms in this piece). That’s all a wash. With that synced over to the devices, the units give me an overview of what’s the day’s route entails.
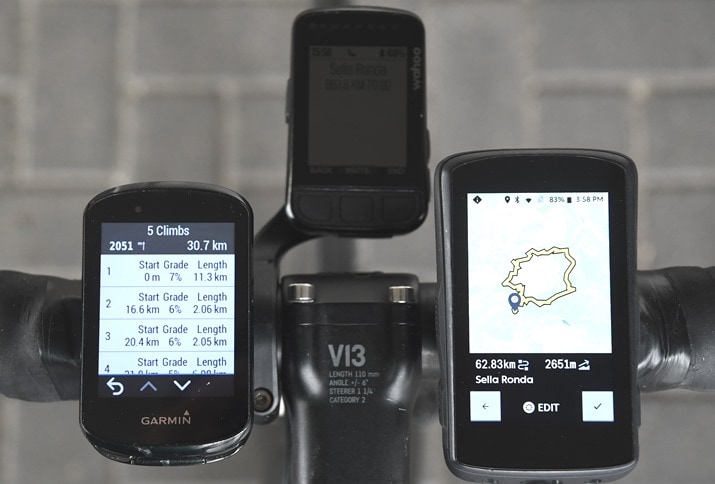
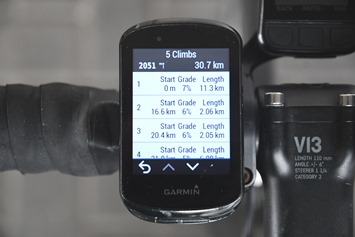
In the case of Garmin, pre-ride, they’ll show your planned map route, some general stats around distance and elevation, as well as each individual climb detail. So I can look at all the auto-categorized climbs, and even tap into a single given climb to see the pain there.
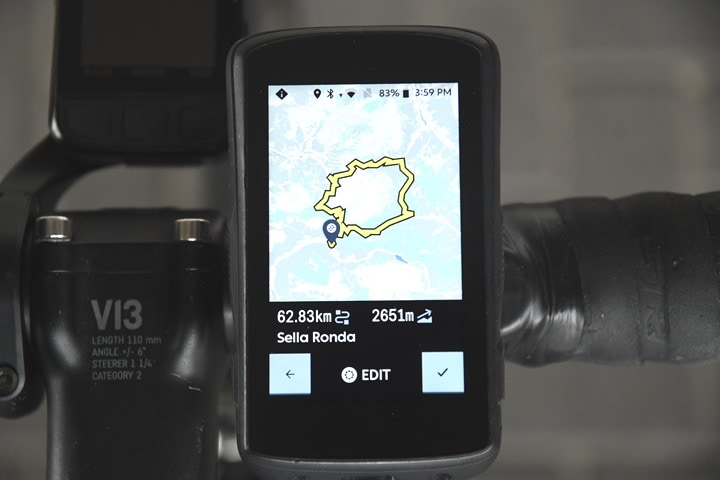
Next, on the Hammerhead unit, they don’t show any climb data pre-ride in the course selection screen. You will get to see the climbs once you load the road (just like on Garmin), but they don’t appear on the pre-ride screens. Nor does Hammerhead show any course profile information, though, they do show the estimated total ascent, which I’ve found is almost always vastly incorrect and overestimated (an accuracy thread we’ll see more of in this post).
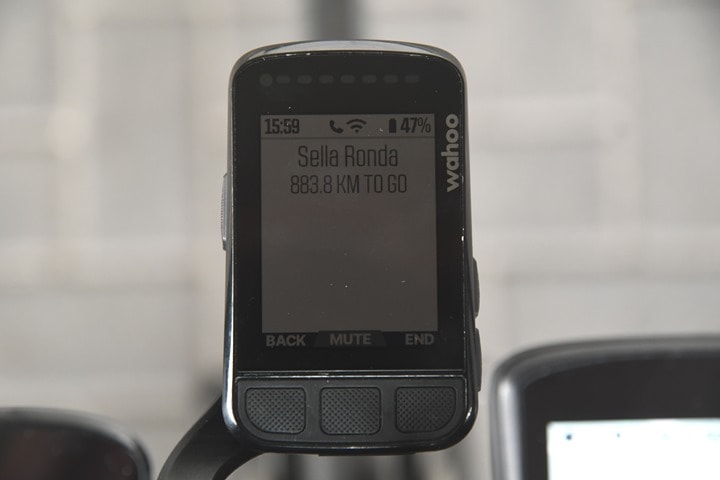
Similarly, Wahoo doesn’t show anything pre-ride when choosing a route, except for the course length remaining (in this case, I didn’t have a handy photo of this next to the course, so it includes the distance from me to the start of the course).
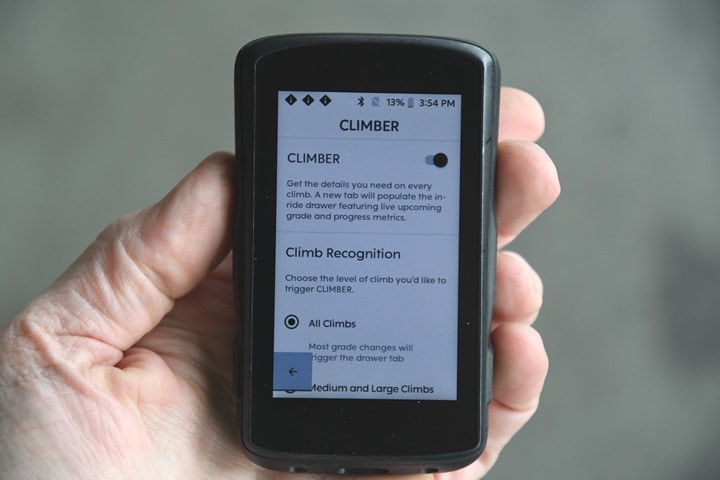
In terms of changing climb-related settings, Wahoo has none. However, Hammerhead does allow you to tweak the climb categorization in the menus. I left it for defaults.
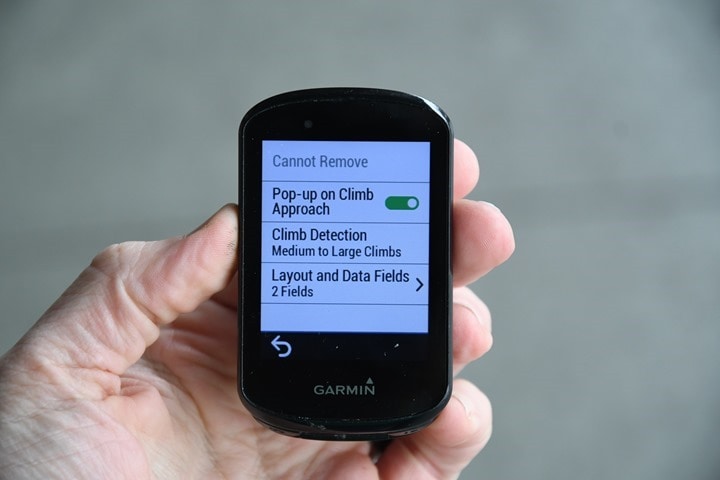
And the same goes for Garmin, which also allows you to tweak which size of climbs to show, whether or not a climb notification appears, and which data fields are shown at the bottom.
With that, I’ll select the climbs and get rolling.
Upcoming Climbs:
Ok, with our ride underway, let’s now look at what it shows on the devices as you start your ride in terms of upcoming climb data. All of these are configurable on each device – so you can disable this if you don’t want it of course. In this case, we might be far away from a climb on flat ground, such as the above photo, which places us 11KM from the first climb (though, notice how Hammerhead and Garmin differ in the start of that climb).
First up, on the Garmin, you have the ClimbPro page. This page will by default show the upcoming climb list, unless you’re in a climb, in which case it’ll show the current climb details (more on that in the next section).
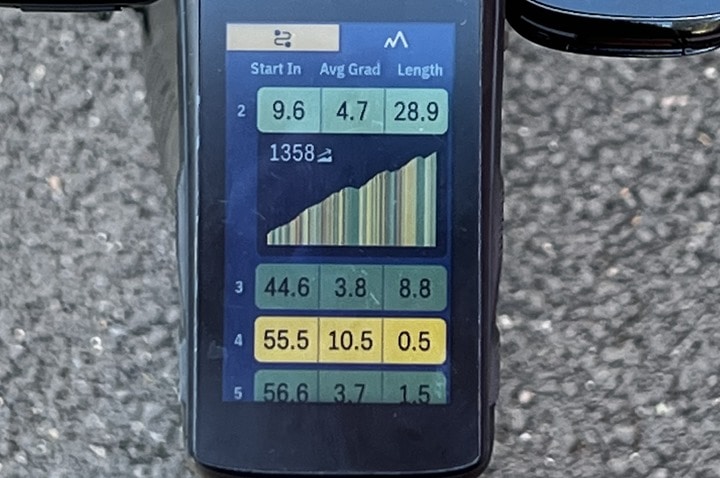
On a Hammerhead device, you’ll get a similar page (this was introduced last December). This page will show you the distance until the start of each climb, the average gradient, and then the length of the climb. If you tap a climb, it’ll expand out to show you that specific climb.
In the case of Wahoo, they don’t show any upcoming climb categorized. Instead, they do show the upcoming elevation profile (as does Garmin/Hammerhead on other pages). You can adjust the scale of this, but it’s just showing you the overall profile, not any data metrics about the climb or climbs coming up.
When I compare Garmin & Hammerhead in terms of this upcoming climbs page, both of them are pretty similar. As with most things on the Karoo, the Hammerhead page is UI-wise prettier, both in the list perspective as well as the individual climb perspective. But functionally speaking, it’s basically a wash between the two.
The main thing you’d notice side by side is that Garmin and Hammerhead categorize climbs slightly differently, in terms of start/end points as well as double-climb scenarios. For example, while major climbs are typically super clear in where they start/stop, it’s the smaller climbs with more shallow starts that differ. If we look at climbs that have multiple pieces to them (e.g. you go up a long time, then maybe flatten out or descend for 30-60 seconds before going up a long time again), Garmin tends to group that as a single climb. Whereas Hammerhead will often split that out.
The precise split varies, but I’d say in most cases Garmin aligns better with how you’d describe a climb to your buddies at a café, “Man, that climb lasted 15KM with 8% gradient”, whereas Hammerhead tends to be the always-right school-teacher about it, “Well actually, that climb was 8KM, then a 200m break, then 6.8KM more”. Thus why on some routes Garmin would say I had 4-5 major climbs, and Hammerhead would be like “Yo, you’ve got 18 climbs!”. Like ice cream preferences, to each their own.
Both companies publish how they categorize climbs, here for Garmin, and here for Hammerhead. The key difference is Garmin requires 500m in length minimum, while Hammerhead is 400m in length. Both require a minimum grade of 3%.
During Each Climb:
Now comes the good part, what you see during each climb. In the case of both Hammerhead and Garmin, it will first notify you as you approach the climb, then the individual climb pages will automatically get enabled when you cross the threshold of the start of the climb. Of course, that threshold might differ between the companies, as noted earlier.
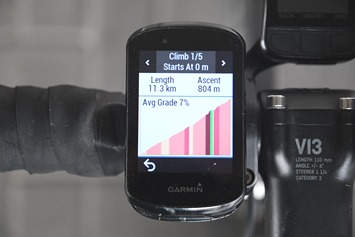
In the case of Garmin’s ClimbPro, you’ll see a page for that specific climb. At the top it’ll say which climb # it is (e.g. Climb 1 of 4), as well as the distance until the next climb. Below that, you’ve got the distance remaining on this climb, as well as the ascent remaining on this climb. These fields update as you ride, eventually whittling your way down to zero.
You’ll also see the climb profile, with color-coded chunks, and your position on the climb, as well as the average gradient remaining for the climb. However, keep in mind that it’ll actually zoom in on a chunk of the climb, rather than show the entire thing. I actually don’t like this particular aspect of it, and wished it just stayed put on the entire climb. At the very bottom of the page are two customizable data fields. In my case, they are current grade and elevation.
Garmin’s color-coding is based on official UCI categorization of climbs, which in turn is based how much elevation you gain in a given time period. The darker the color, the more painful it is.
- Cat 4 > 8000
– Green - Cat 3 > 16000
– Yellow/Gold - Cat 2 > 32000
– Orange - Cat 1 > 48000
– Red - HC (Hors Category) > 64000 – Dark Red
Next, we’ve got Hammerhead and their individual climb page. This page easily takes the cake on the prettiest climb page, with theoretically the most detail. It’s offered in both a half screen height and full-height option:
Their color-coding is as follows:
- 0-4.4%: Dark green
- 4.6-7.5%: Light green
- 7.6-12.5%: Yellow
- 12.6-15.5%: Pink/peach
- 15.6%-19.5%: Orange
- 19.6%-23.5%: Red
- 23.5%+: Purple
For the upper portion you’ve got the entire climb displayed in 500m long colored increments, along with your position on it (and your completed portion shaded). I immediately like this better than the Garmin approach which zooms in. It’s also got color-coding on the pain-factor throughout the main climb details. Below that is a list of numbers that scroll by. These are 100m long chunks with the expected gradient in each of those chunks. So basically, you can see the next 500m with of gradient within the scrolling ticker.
The problem though? This data isn’t accurate. Especially at the extremes (e.g. higher grades), hairpin turns, or in mountainous terrain. This is because whatever data source they’re using simply isn’t granular enough for this. So countless times it’ll say I’ve got a 14% chunk coming up, and it’ll just be more of the same 4-6% I’ve been riding (like the above photo). When I asked Hammerhead about this previously, they acknowledged the issue, saying:
“We have been wrestling some of these elevation data errors and looking at ways to better handle unrealistic spikes or swings in the data. Your intuition is correct in that it is often based on the underlying dataset that we are using for a particular region. We have got our hands on most of the readily available ones and are running some experimentation on how to handle bad data. We fit offline elevation data for an entire downloaded country onto Karoo 2 so that even re-routes can have Climber functionality. This offline functionality also means that we can’t rely on any backup or massaging of the data from different sources on a web server. We have a few methods we are looking at to improve this.”
Ultimately, this becomes a case of form over function. Yes, it visually looks super cool. But practically speaking, it’s often inaccurate (in fact, almost always inaccurate). And it’s ultimately why Garmin probably isn’t showing such granular detail. In Garmin’s case, they’re slicing it up into far larger chunks for color-coding, which means they can smooth out some of the underlying data inconsistencies. Below is a good example of bad data – this road never had anywhere even remotely close to a 25% grade section (nor one then followed apparently by –9.3% downhill section). However, if you look closely at the yellow Garmin section below, you can see what appears as a spike in the climb, but in Garmin’s case they aren’t granular enough displaying data related to that, to draw your attention to it.
Anyways, below that streaming gradient ticker section, is the distance to the top, and the elevation to the top (plus climb # and current grade). One interesting note though, is that Hammerhead does not properly count mid-climb descents here. So for example you see that little bump where I go down for a few hundred meters on the above? In that case, Hammerhead doesn’t accurately show my total ascent as having to ‘reclimb’ that portion twice. Instead, their math is simply your goal elevation (top), minus the current elevation. So any brief downs within it aren’t calculated correctly, and will undercount how much climbing you actually have to do still. If your climb has no brief descents, then it’s a non-issue.
Still, if we step back and look at the overall gist of what the ticker and climb charts are showing you, I think Hammerhead is largely on the right path here. I suspect if they shifted away from 100m sections, and instead went more towards 200m or larger sections, it’d be enough to get around some of the short-distance accuracy issues they have. And similarly, fixing the ascent to top should be easy since they know the descents just as much as they know the ascents.
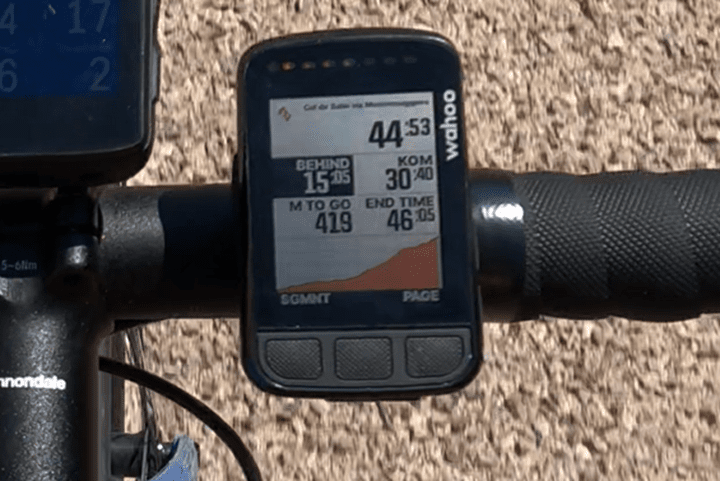
As for Wahoo, again, they have no direct climbing feature. But they do actually have one workaround: Strava Live Segments. If you star/favorite a Strava Live Segment for that climb (which is usually easy enough to find/tag), it’ll trigger as you approach the climb and then show your exact distance till the end of the climb. Plus the upcoming elevation profile. It won’t show ascent or other climbing-related metrics, but it at least shows how much suffering you have left, along with how poorly you’re doing relative to all your friends.
Though, on one particular long climb last year, I just adopted Wahoo’s BOLT for my own Haribo-Pro. One gummy per 1KM remaining. Albeit, this does impact display visibility, but, when you’re climbing for hours on end without climbing metrics, you mostly get into the groove anyways.
Finally, some will ask about actual gradient responsiveness. Meaning, how fast does each bike computer respond to gradient shifts and display that on the unit itself. And the answer is “it depends”. In general, it seemed like the Hammerhead and Wahoo units reported shifts in gradient more quickly as the road changed pitch. But not all the time. In the video I show a bit almost back to back where on one road chunk the Garmin lagged, but then moments later it was the Wahoo lagging. Keep in mind, when I say ‘lagging’, we’re talking a couple of seconds. You can see examples of the differences.
The reason for that is that these companies are largely looking at forward movement to determine grade, not the current angle of your bike. So they look at how much elevation you’ve gained in the last X seconds, and then figure out the gradient based on the distance you travelled. It’s a fine line between being too quick to respond to shifts in pressure (which would lead to inaccurate data), and being too slow (which leads to frustration). For virtually every scenario I encountered, there were no meaningful real-world differences between them on this topic.
In the sense that, yes, sometimes one unit was behind another a few seconds, but unless this was crossing a shallow 100m long bridge, it just didn’t make a big difference to me that it was 2-3 seconds behind showing 6% vs 8%. For any meaningful climbs, it evened out within a few seconds and showed me seemingly correct values across all devices.
Going Forward:
Of course, as we approach the springtime, we historically see gains on cycling head units. It’ll be interesting to see if there are shifts here, from all the players. I think it’s obviously critical that Wahoo somehow get in this realm, especially as Hammerhead continues to improve theirs with each iteration every few months. Meanwhile, Garmin could look to add a bit more detail like Hammerhead, while Hammerhead inversely could aim to try and get their underlying gradient data either more accurate or perhaps less granular to, in turn, increase upcoming gradient accuracy.
And then beyond that, all the companies could introduce added climbing features that haven’t been thought of yet. There’s countless ways this could be expanded, and we only need to look at other feature areas to see that. For example, Garmin recently introduced enhanced waypoints support (called ‘Up Ahead’) on their Fenix 7/Epix series, or, nobody has made a way for this to be sans pre-loaded route – a long-requested feature by many.
Or, the companies could do a better job of surfacing these climbs in their post-ride analytics apps, showing the times and efforts after the fact, similar to Strava Segments, but without all the jumble of numerous segments. Just a clean list of the climbs and one’s performances on those climbs.
Still, both the Hammerhead and Garmin climbing features remain my favorite features on each unit. Perhaps less for technical reasons, and more for nostalgia reasons. In my case, when I’m using these features to their fullest extent, it’s because I’m off on some bike adventure somewhere – often on an epic climb with amazing scenery. And as the snow melts, it’s almost time for that to begin again. So if and when these companies make changes, I’ll be ready to put them to the test again.
With that – thanks for reading!
![clip_image001[8] clip_image001[8]](https://media.dcrainmaker.com/images/2022/03/clip_image0018_thumb.jpg)
![clip_image001[6] clip_image001[6]](https://media.dcrainmaker.com/images/2022/03/clip_image0016_thumb.jpg)
![clip_image001[26] clip_image001[26]](https://media.dcrainmaker.com/images/2022/03/clip_image00126_thumb-1.jpg)
![clip_image001[12] clip_image001[12]](https://media.dcrainmaker.com/images/2022/03/clip_image00112_thumb.jpg)
![clip_image001[32] clip_image001[32]](https://media.dcrainmaker.com/images/2022/03/clip_image00132_thumb.jpg)
![clip_image001[30] clip_image001[30]](https://media.dcrainmaker.com/images/2022/03/clip_image00130_thumb.jpg)
![clip_image001[28] clip_image001[28]](https://media.dcrainmaker.com/images/2022/03/clip_image00128_thumb.jpg)
![clip_image001[24] clip_image001[24]](https://media.dcrainmaker.com/images/2022/03/clip_image00124_thumb.jpg)
![clip_image001[16] clip_image001[16]](https://media.dcrainmaker.com/images/2022/03/clip_image00116_thumb.jpg)
![clip_image001[18] clip_image001[18]](https://media.dcrainmaker.com/images/2022/03/clip_image00118_thumb.jpg)
![clip_image001[22] clip_image001[22]](https://media.dcrainmaker.com/images/2022/03/clip_image00122_thumb.jpg)
![clip_image001[10] clip_image001[10]](https://media.dcrainmaker.com/images/2022/03/clip_image00110_thumb.jpg)

0 Commentaires