Today Suunto has started rolling out a pretty expansive upgrade to their smartphone app, which adds in a slate of training load related metrics, all driven by TrainingPeaks terminology. We’ll get into all the details here, but what’s notable is that there’s no specific watch model requirement here, this is being done at a platform level and thus anything syncing into the Suunto App is now accounted for (in theory anyway).
Note that the rollout starts today on iOS, and tomorrow on Android. Though when exactly it’ll show up on your phone will depend a bit on app store syncing and such. Meaning, if it doesn’t show up *THIS VERY SECOND*, try going for a run or sleep, and it’ll probably be there.
This is most interesting to me for a few reasons. Sure, it’s important for Suunto to address training load and recovery at the platform level, as they’ve largely ignored in recent years it while companies like Polar, Garmin, and COROS have turned on ‘all the things’. But more interestingly, it’s the effective offloading to TrainingPeaks for the algorithms that’s interesting. While many companies have shown metrics like TSS/NP before on a per activity basis, there’s decidedly few (if any?) that have fully licensed CTL/ATL/TSB (plus all the TSSx variants) specifically into their platforms while also producing hardware. Sure, companies have effectively duplicated these by other names – but less so complete licensing.
In any case, let’s dig into it.
How it works:
To begin, you’ll obviously need some sort of Suunto device, that’s connected in some way to the Suunto app. Certainly if you’ve read this far, then you’ve probably got a Suunto device (or considering getting one). That’s notable about this open-ended requirement though is that there’s no specific need for a given model. Meaning, this isn’t limited to just the Suunto 7 or just the Suunto 9.
Instead, Suunto is doing all of this processing on the platform side, rather than the watch side. That’s good news for older watch wearers that are getting free firmware updates. Though slightly less optimal in that you won’t see any of this on your own watch, even a newer one. This is purely an app and platform update. However, the benefit there is that Suunto has processed all data back to January 2021 (so the last four months’ worth). In fact, if you update the app today (or tomorrow), you’ll instantly get this entire calendar year’s worth of data. #WinningByDoingNothing
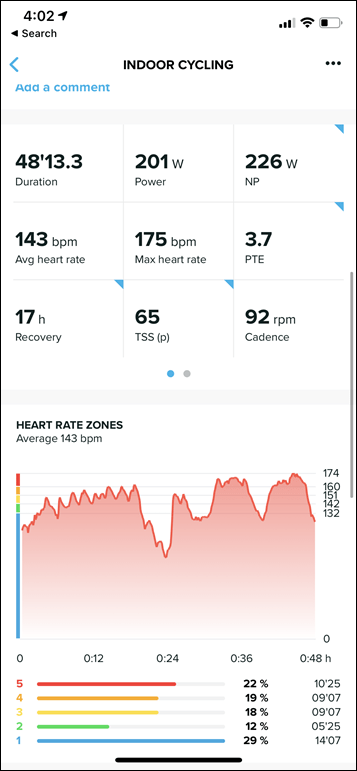
Everything here is largely first based off of your Training Stress Score (TSS, which is a thing trademarked by TrainingPeaks). Typically speaking this is calculated based on power (e.g. cycling power), pace (swimming or running), or heart rate (everything else). The harder a workout, the higher the value. You can see in my workout a few hours ago, this so-so intensity trainer ride has a TSS score of 65:
However, typically speaking a TSS value is calculated based on your FTP (Functional Threshold Power) – for cycling anyway. Similar things exist for running and swimming, but we’ll set those aside for the moment. Except the problem is that Suunto doesn’t have any tracking of FTP in their platform, thus instead, they’re using the line between Zone 4 and Zone 5 heart rates. In Suunto-speak, the upper edge of Zone 4 should be 99% of your anaerobic threshold.
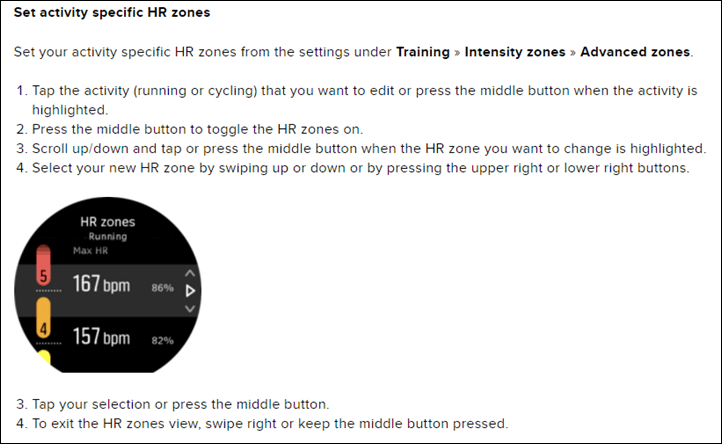
So you’ll want to set these zones within your watch, in order to get the correct TSS values. Suunto has zones for cycling and running. Here’s the quick snippet on how to do that, from their site here:
Of course, the obvious problem here is that many people don’t know exactly what their upper Z4 value should be, even if they know their FTP. For myself, I know what my FTP is, but frankly, I have no idea off the top of my head what the upper Z4 value should be. Which will ultimately impact the accuracy here.
This doesn’t mean it’s useless or horribly wrong. Suunto devices will automatically determine these zones if you know your max HR, and that’s probably a bit easier for most people to figure out (either through a VO2Max test or an FTP test).
Suunto supports the following types of TSS load in their platform:
Tss (r) – Running Pace
TSS (hr) – Heart rate
TSS (p) – Power
TSS (s) – Swimming Pace
TSS (met) – Metabolic base
TSS – Manually entered value
So, if you were to scroll back up slightly, you’ll see my indoor trainer ride was TSS (p) because I used a power meter on my bike to calculate it.
In any case, anytime you talk training load metrics or recovery you need lots of data, many workouts worth. That’s even more so true when you’re talking about comparing CTL/ATL/TSB, as the very nature of CTL is a look at the 6-week training load. Since I don’t have that in my Suunto account, I’m going to switch over to some Suunto screenshots to illustrate it.
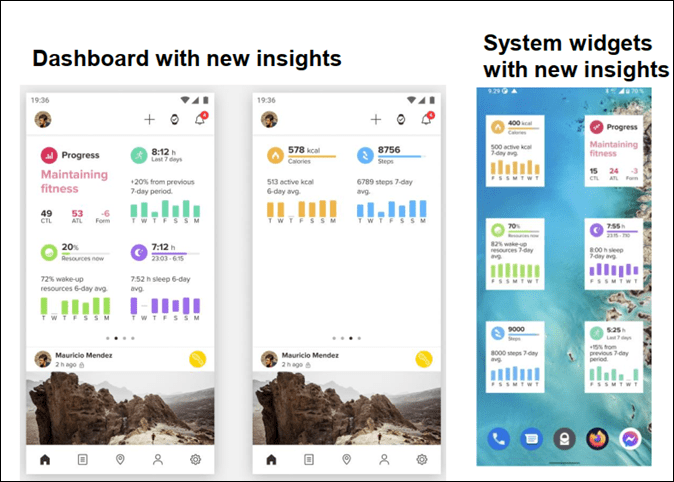
First up is that Suunto has actually exposed this data as a system widget you can pin on your screen – at least on Android. I don’t see it on iOS at this point, but maybe that’s in the hopper. Here’s what that looks like on Android for someone with actual data (to the right). Meanwhile, on the left side you’ll see the new ‘Progress’ section from the main page of the Suunto app, showing CTL/ATL and TSB (aka Form) data:
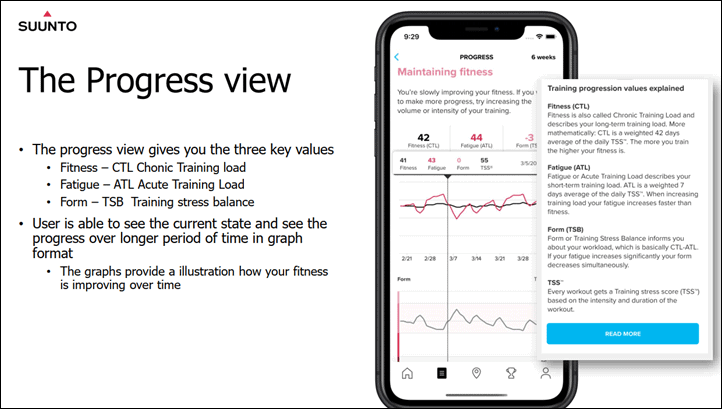
Next, within the progress section of the app you’ll see your CTL/ATL/TSB data up top, as well as a 6-week chart. You can change the chart type from 6 week to 26 week or 13 month.
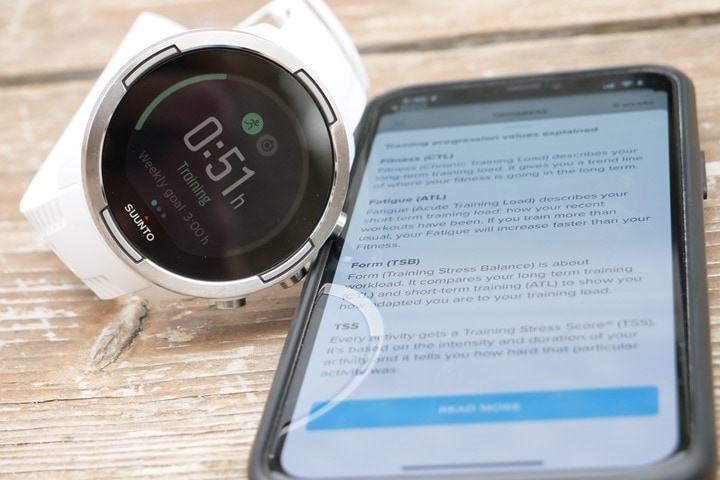
There’s plenty of other resources to dive into all the nuances of training load (regardless of algorithm choice), so I won’t re-hash all that here. But a slide from their media brief consolidates it all quite nicely, allowing you to relatively clearly see the impact and relationship of each of these on each other:
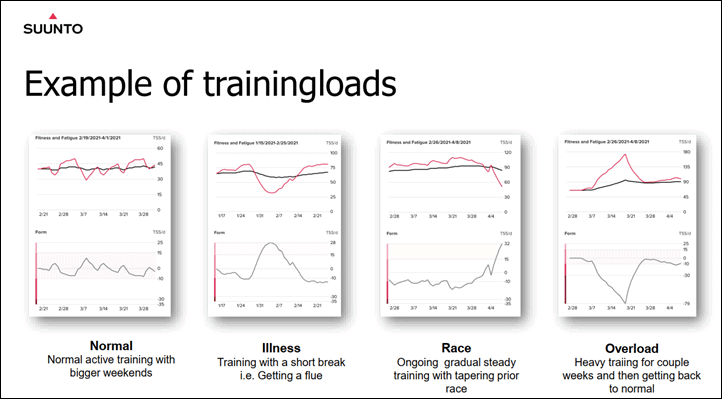
And then this little gallery shows the simplified explainers of what’s happening on each of these individual variants, in terms of the training load and recovery:
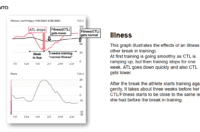
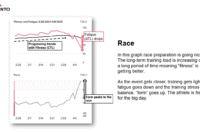
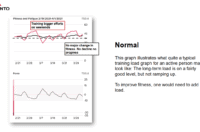
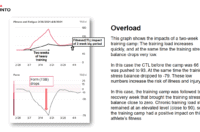
Now, at it’s core, this is a relatively simplified version of what you’d get if you were to actually sign-up for TrainingPeaks. But it’s notable that there’s *ZERO* requirement to sign-up or have a TrainingPeaks account to get this. So to the user that doesn’t know or care about TrainingPeaks, one could just as well call this SuuntoLoad™, and it’d be no different.
However, Suunto acknowledges this won’t likely be deep enough for everyone. In my call with them they noted that it’s “designed as a simple basic tool to understand this, and then if you wand the deep dive, TrainingPeaks is the best service for that”.
Related, things might not match perfectly between what you see in the Suunto app, and what you’d see on TrainingPeaks. That’s because of that lack of FTP parameter (in the case of cycling), as well as the fact that in the case of running, Suunto is basing their TSS atop heart rate whereas TrainingPeaks is doing that calculation atop NGP (graded pace). Still, Suunto says that in their testing they’re seeing only a couple units difference. For example you might see 85 on Suunto, versus 87 on TrainingPeaks. Remember to also ensure that your TrainingPeaks FTP values align to the HR values you’re using on Suunto. Otherwise, things will still be different.
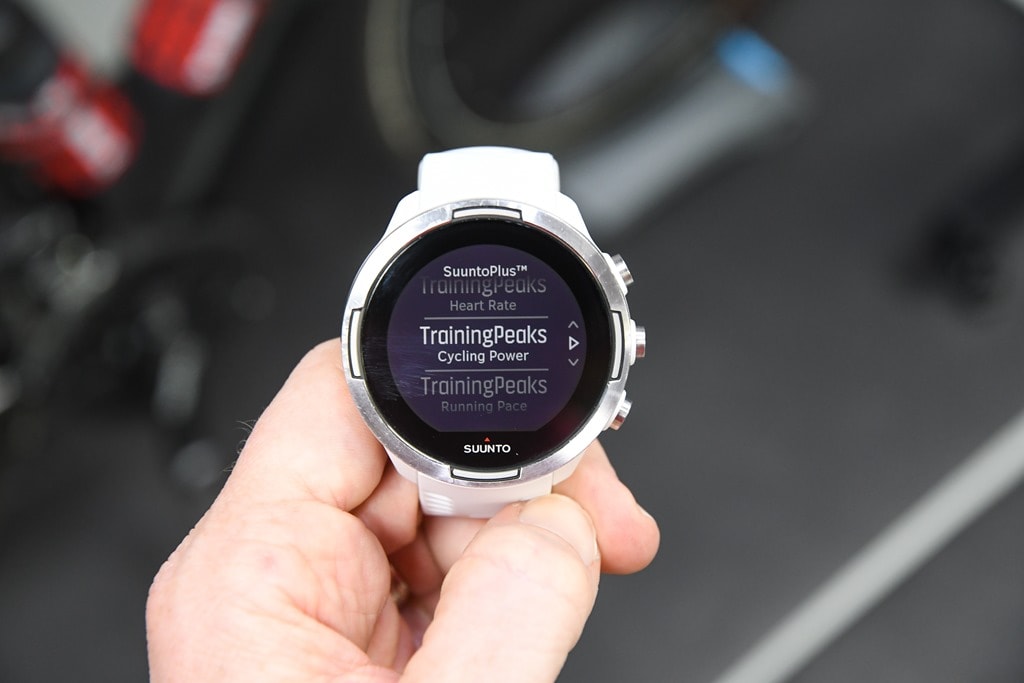
Inversely, there’s actually some areas that Suunto is handling that TrainingPeaks isn’t. For example, Suunto calculates the load for some 80 different sports in the watch, whereas TrainingPeaks doesn’t support as many sport types. Note however that while Suunto has their SuuntoPlus widget (shown below) for TrainingPeaks which shows TSS, that isn’t actually tied in here. This is all calculated on the backend.
And finally, for lack of anywhere else to mention it – in this same app update there is now the ability to export as a GPX file. Previously it was just FIT files.
Wrap-Up:
It’s good to see that Suunto is focusing back on the endurance athlete and the training associated with that. Certainly, this is just one step that’s needed, but it’s a step forward. I think many had seen the continued rise of numerous training load metrics from various competitors over the last few years and wondered whether or not Suunto was going to watch the competition run away.
Obviously, as other platforms have started to illustrate, training load and recovery is more than just the workout itself. It’s sleep – but more specifically sleep quality. And we need only roll back one week ago to Suunto adding in Firstbeat’s Sleep Quality metrics to the Suunto 7 – nearly identical to the Firstbeat metrics which Garmin also just rolled out today to the Forerunner 245/745/945 in beta. Sleep is just as important in training and recovery as doing intervals or long rides/runs. Without it, there will be no gains.
Finally – it’s interesting to see the TrainingPeaks tie-up here. I’ve gotta wonder if there’s an opportunity for TrainingPeaks to ultimately expand more into the training sciences side of the house, and offer more algorithms for sale akin to what Firstbeat does (currently TrainingPeaks largely just licenses the terms like TSS/NP/IF). Given Garmin’s acquisition of Firstbeat, I’d think that there’s probably a number of Garmin competitors that would be open to more closely aligning themselves with TrainingPeaks than a division of Garmin, for these sorts of training load and recovery metrics. I’d think it’d be much easier for a company like Wahoo, to say “Wahoo RIVAL watch with training load and recovery powered by TrainingPeaks” than to say “Wahoo RIVAL, with training load and recovery powered by Firstbeat, a division of Garmin…our rival.”
I mean, just sayin’.
With that – thanks for reading!
![clip_image001[6] clip_image001[6]](https://media.dcrainmaker.com/images/2021/04/clip_image0016_thumb-1.png)


0 Commentaires